Julius Experiment
For a school project Julius needed to measure the transparency of aglass of water mixed with an increasing amount of (strong) tea. The
fraction of tea rises from 0 to 1 with steps of 0.2. The transparency
was measured with an app on his iphone.
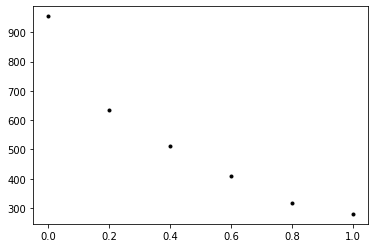
His data are given here as x (= tea fraction) and y (= transparency).
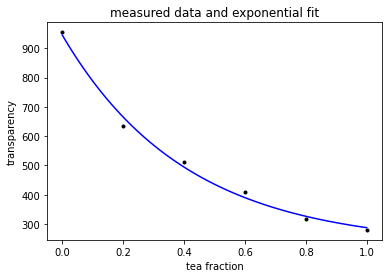
We have modelled it with an exponential decay plus a constant
background.
In[1]:
import numpy as numpy
import math

from astropy.io import ascii
from BayesicFitting import ExpModel
from BayesicFitting import PolynomialModel

from BayesicFitting import LevenbergMarquardtFitter
from BayesicFitting import formatter as fmt
from BayesicFitting import plotFit
from BayesicFitting import Tools
import matplotlib.pyplot as plt
In[2]:
#%matplotlib osx
In[3]:
x = [ 0, 0.2, 0.4, 0.6, 0.8, 1.0]
y = [955, 634, 513, 411, 317, 280]
In[4]:
plt.plot( x, y, 'k.' )


plt.show()
Out[4]:
In[5]:
model = ExpModel() + PolynomialModel( 0 )
model.parameters = [700, -10, 200]
ftr = LevenbergMarquardtFitter( x, model )
par = ftr.fit( y )
print( par )
Out[5]:
[718.53092773 -2.46766391 226.80115419]
In[6]:
plt.plot( x, y, 'k.' )

xx = numpy.linspace( 0.0, 1.0, 101 )
yy = model( xx )
plt.plot( xx, yy, 'b-')
plt.xlabel( 'tea fraction' )
plt.ylabel( 'transparency' )
plt.title( 'measured data and exponential fit' )
plt.show()