Temperature of the Rhine at Lobith
Yearly averages of the water temperature of the Rhine at Lobith.Author: Do Kester
We need to import some classes
In[1]:
import numpy as numpy

from astropy.io import ascii
import matplotlib.pyplot as plt

from BayesicFitting import PolynomialModel
from BayesicFitting import Fitter
from BayesicFitting import formatter as fmt
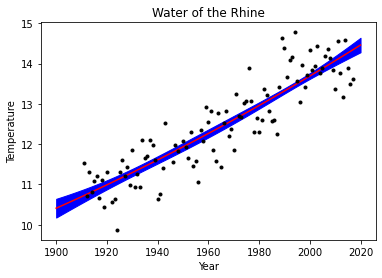
Read the data. Subtract 1900 to get ``nicer'' data during the fit.
In[2]:
tbl = ascii.read( "data/temp-rijn.txt" )
jr = tbl['Jaar'].data
te = tbl['gemiddelde'].data
jr -= 1900
Make a model: a Polynomial of order 2
In[3]:
mdl = PolynomialModel( 2 )
print( mdl )
Out[3]:
Polynomial: f( x:p ) = p_0 + p_1 * x + p_2 * x^2
Select a fitter.
In[5]:
ftr = Fitter( jr, mdl )

par = ftr.fit( te )

print( "params :", fmt( par ) )
print( "stdevs :", fmt( ftr.stdevs ) )
Out[5]:
params : [   10.410    0.028    0.000]
stdevs : [    0.230    0.008    0.000]
In[6]:
#plt.plot( jr + 1900, te, 'k. ' )
xx = numpy.linspace( 0, 120, 121, dtype=float )
yfit = mdl( xx )
yerr = ftr.monteCarloError( xdata=xx )


fig, ax = plt.subplots()
ax.plot(xx+1900, yfit, 'r-')
ax.fill_between( xx+1900, yfit - yerr, yfit + yerr, color='b' )
ax.plot(jr+1900, te, 'k.')


plt.xlabel( "Year")
plt.ylabel( "Temperature")
plt.title( "Water of the Rhine" )
plt.show()